
The same mistake appears everywhere in growth: spend money to get users, measure sign-ups, declare success. The problem is that sign-ups aren't revenue. Clicks aren't patients. Downloads aren't LTV.
The work I've done in growth - across a global consumer marketplace and a 44-clinic healthcare network - starts from the same question: what does this user actually contribute, and which acquisition channels are producing those users? Everything else follows from closing that loop.
Action Urgent Care - Chief Growth Officer, 2016–present
Action Urgent Care had a growth problem that looked like a marketing problem but was actually a measurement problem. They were buying ads and assuming they worked. No attribution model. No closed-loop data. No way to connect campaign spend to insurance reimbursements that arrived weeks later.
I joined as Chief Growth Officer in 2015 and built the entire patient acquisition system from scratch - website, patient portal, scheduling flow, phone tracking, closed-loop attribution model, review generation funnel, and a location selection algorithm that guided a 44-clinic footprint across the Bay Area. This isn't a story about running better ads. It's about building the measurement infrastructure that made the ads worth running.
Building a Closed-Loop Attribution Model From Zero
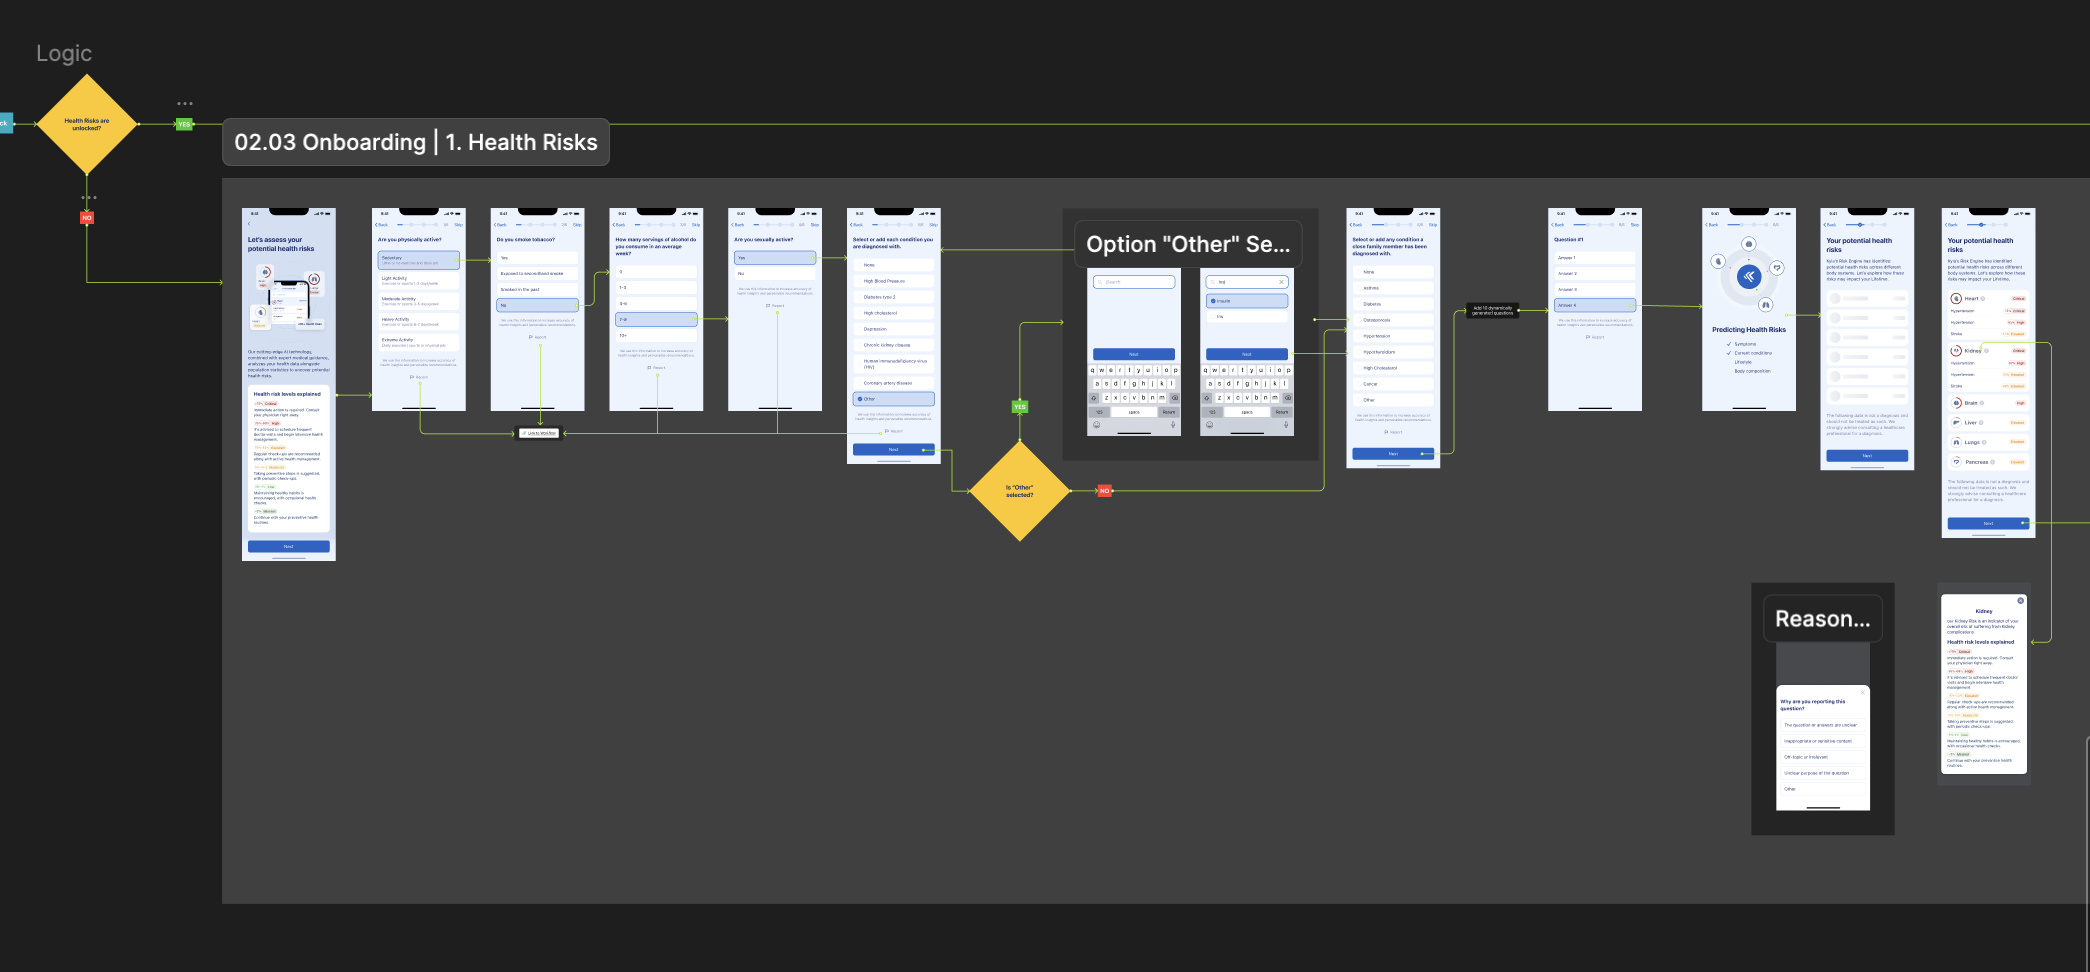
Urgent care economics create a specific attribution problem: insurance reimbursements arrive weeks after the visit. Without a system matching delayed payments back to acquisition events, there's no closed loop - just spend going out and revenue coming in with nothing connecting them.
When ads at one location were mistakenly turned off, I took the opportunity to verify the data and revealed the campaigns had been generating just 3–5 additional visits per week - and even then, nobody knew what insurance had ultimately paid. The entire ad budget was operating on assumption.
What I built: Call tracking by campaign and source. Landing page and booking flow instrumentation by acquisition channel. Lowered friction sign up flow (ex. Automated Insurance Verification). A matching model that tied delayed reimbursements back to original acquisition events. An ad management platform built around optimized spends and actual patient revenue, not proxies like clicks or form fills.
This all generated $2.60 for every $1 spent.
Removing the Operational Ceiling on Patient Volume
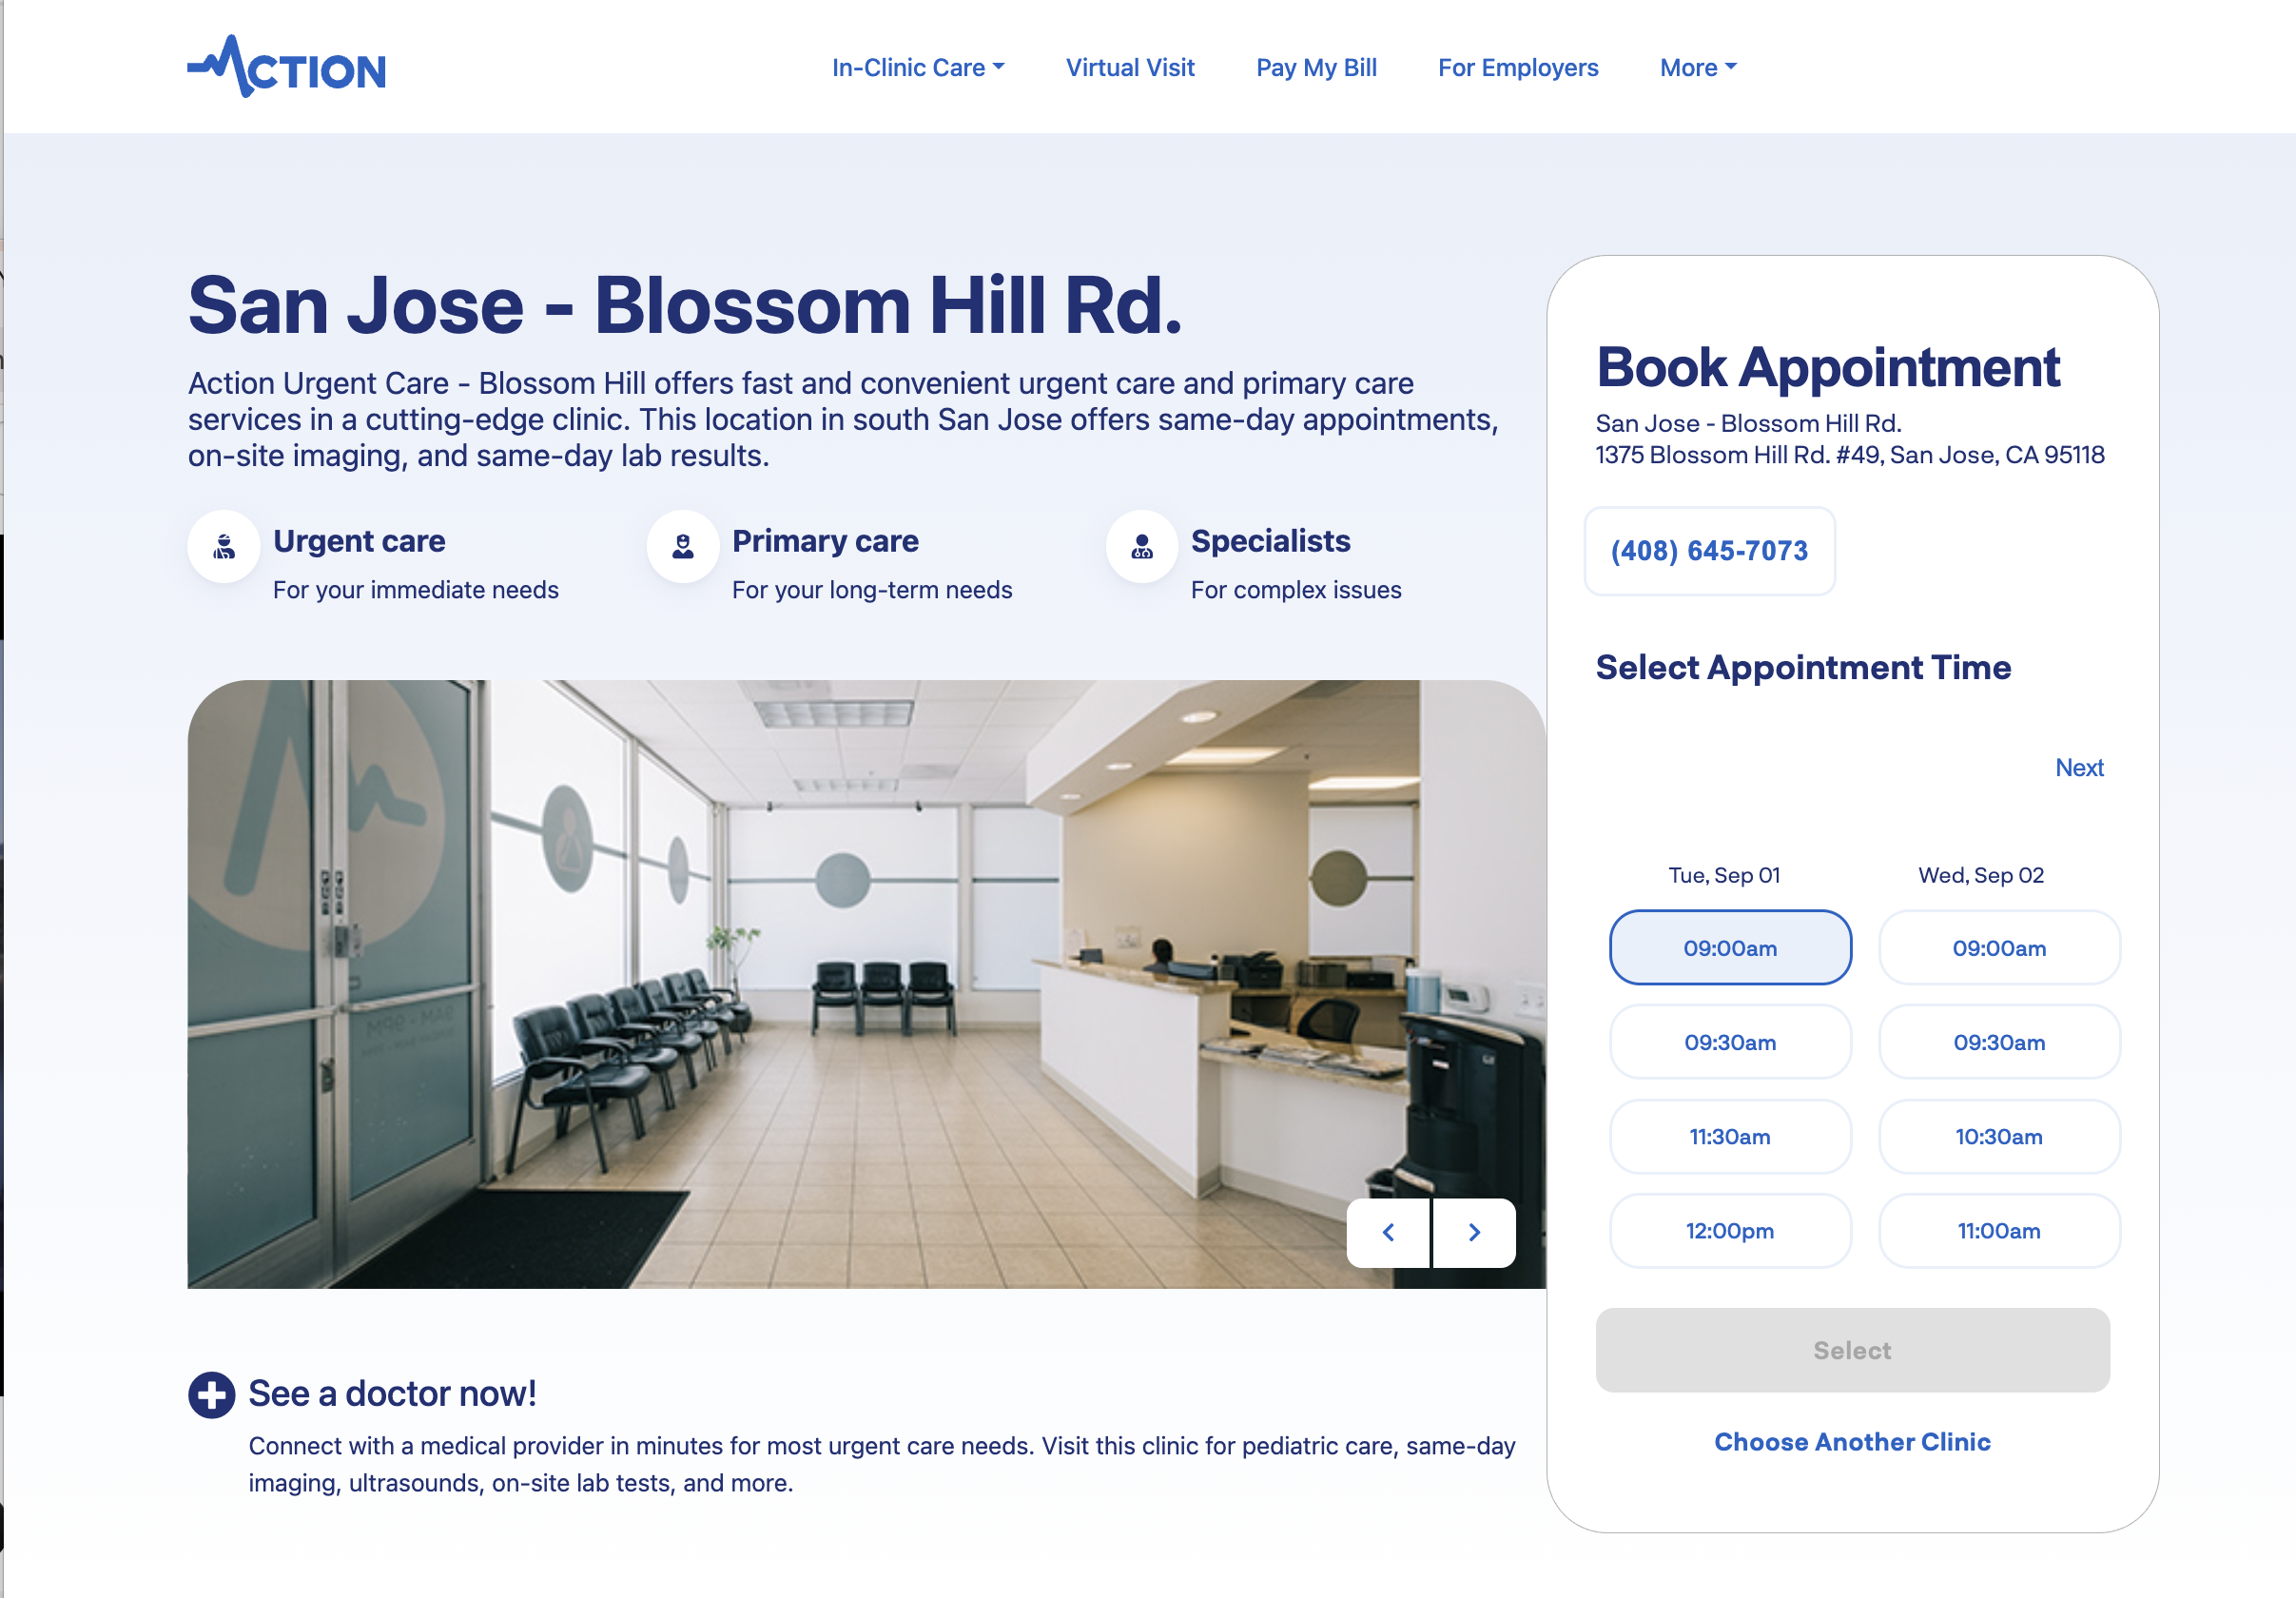
Patient volume wasn't capped by demand. It was capped by friction - a clunky booking flow, insurance verification that created drop-off before the visit, and a visit experience not generating the reviews that drive local search ranking.
A clinic that can't verify insurance at signup loses patients before they experience any value. I designed and built an automated insurance verification checker integrated into the onboarding flow - lightweight for the patient, robust on the backend - achieving a 92% insurance verification rate and directly reducing drop-off at the most critical point in the funnel.
The review funnel discovery was a threshold effect, not a gradient. Clinics rated 4.0–4.5 saw meaningfully lower organic traffic than those above 4.6 - and above 4.8 performed significantly better still. It wasn't a smooth curve. It was a cliff, and most clinics were sitting below it. I built an automated post-visit review generation funnel triggered at the right moment after discharge, and ran it across the network until every clinic cleared 4.8.
An Algorithm for Where to Open Next - and Building the Clinics
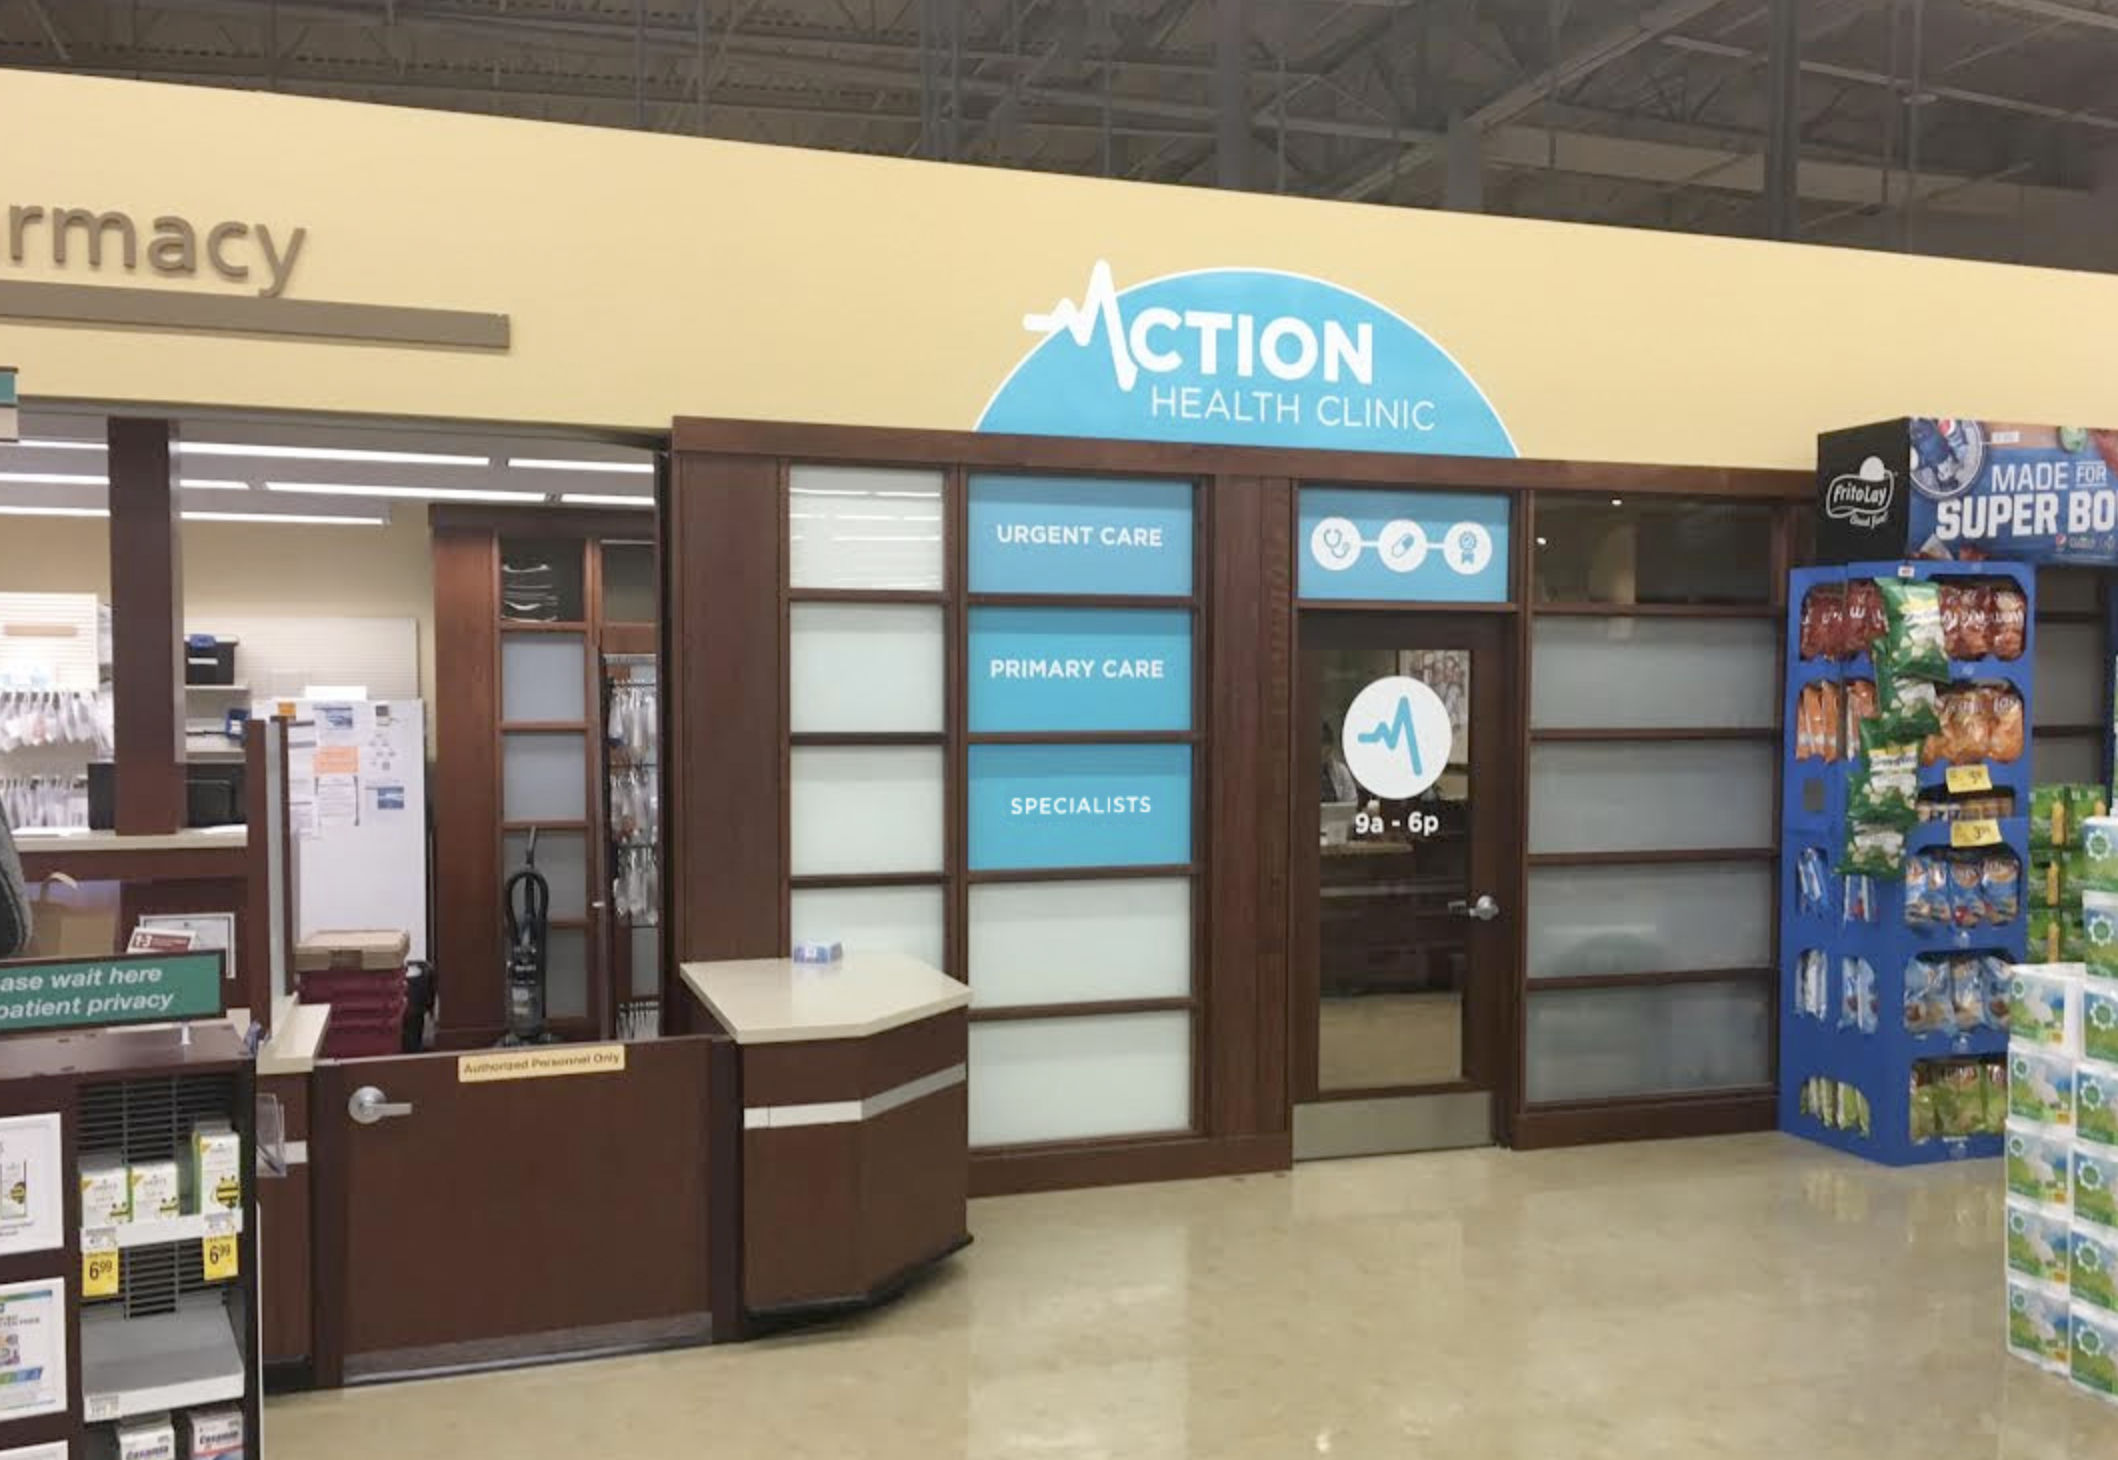
A Safeway partnership offered a unique growth opportunity - small embedded offices inside Safeway retail locations.
Taking advantage of these spaces required solving two distinct problems: knowing where to open, and knowing how to open there. I built an algorithm weighing competitor density, proximity to existing locations, neighborhood review averages, and site-specific foot traffic data to find the optimal locations.
Then I designed each Safeway clinic from scratch: floor plan, graphics, signage, construction coordination and stood up the complete digital stack per location - video screen and video conferencing install, scheduling configuration, phone tracking, individual web presence.
LivingSocial - Creative Director, Growth

LivingSocial outcomes
LivingSocial was spending heavily on user acquisition when I came in as Creative Director for Growth. The problem wasn't the spend - it was that nobody had connected it to what users actually did after signing up. Sign-up rates looked healthy. What wasn't being measured was whether those users bought anything.
Tying ad spend back to actual user revenue - not registrations, not clicks - revealed that the most expensive acquisition channels were producing the least valuable users. The channel mix changed completely.
Connecting Acquisition Spend to Actual User Revenue
The standard growth metric at most consumer companies is acquisition volume - how many users did we add this week? LivingSocial had that number. What it lacked was a view into whether those users spent money on deals after signing up.
I built the framework to tie each acquisition channel back to Net Revenue Per User. The finding was significant: channels generating strong sign-up volume were producing users with dramatically lower NRPU than cheaper channels. We were paying a premium for users who didn't buy. Redirecting spend based on actual user value - not acquisition cost - drove the conversion and revenue improvements that followed.
A Modular Ad System Built for Global Testing

LivingSocial operated across 20+ countries. Running localized ad creative at that scale using traditional production methods was impractical. I designed a modular ad architecture where each ad was built from independently swappable components - the visual, the headline, the body copy, the button text.
Any combination could be assembled and tested across geographies simultaneously. What emerged was unexpected: certain food photography performed well in some countries and underperformed in others - not because of translation, but because of what felt local and familiar. The modular system made it possible to find those differences at scale rather than assuming global creative could be uniform.
I also developed location-specific deal ads surfacing the most relevant offer per market - showing a user the deal nearest them, not the nationally promoted item - which drove meaningful lifts in actual deal purchase rates.
Five Rules for Ad Visual Effectiveness
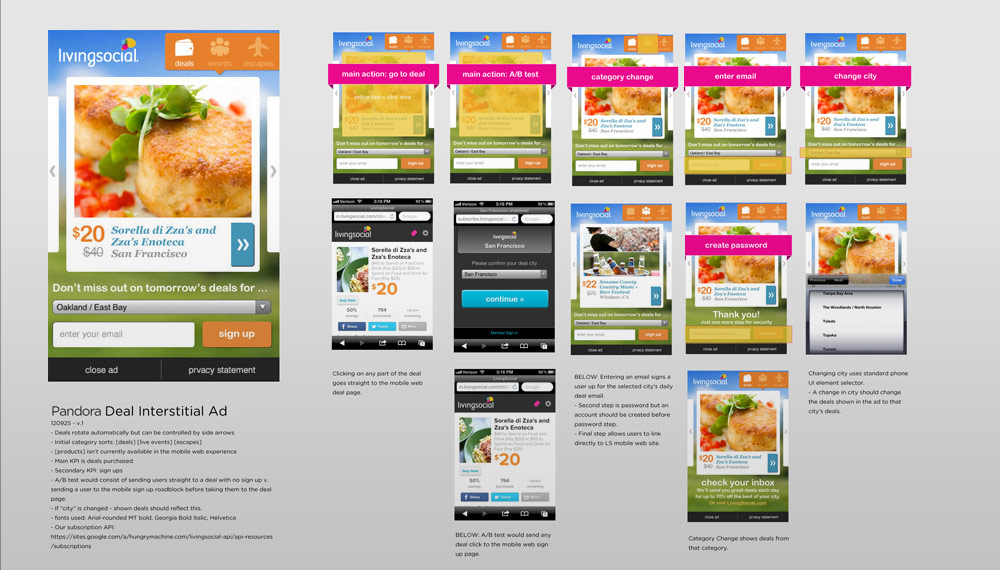
After analyzing performance data from millions of dollars in ad spend, a pattern emerged: the images that performed best consistently shared identifiable qualities. I developed five rules for visual effectiveness in ad creative - Contrast, Focus, Depth, Texture, Color - that could be applied when selecting or evaluating a photo for a given ad format.
These weren't aesthetic preferences. They were derived from what performed. They gave the team a repeatable framework for image selection rather than gut judgment or A/B testing every creative decision from scratch. The rules became part of the creative pipeline - a filter applied before testing, which raised the baseline quality of everything entering the system.
Tradecraft Mentor

I've taught growth at Tradecraft in San Francisco - a program that gives students real-world exposure to growth strategy. The sessions focused on LTV, channel attribution, and the core distinction between acquisition volume and acquisition value.
"After three months, all of us still considered Nic's LTV growth sessions as the best learning experience in the whole program."
- Sven Diechfuss, Tradecraft Growth Track
The through-line
Growth work that optimizes for acquisition volume tends to be expensive and fragile. Growth work that closes the loop between spend and actual user value compounds. The attribution model is never the flashy part of a growth strategy - but it's what makes the rest of it real.
At LivingSocial, that meant tying sign-ups back to deal revenue and rebuilding channel strategy around what users actually spent. At Action Urgent Care, it meant tying ad spend to insurance reimbursements arriving weeks later. Different industries, different mechanics - same question.